What’s the Deal with Vectorized Backtesting? (And Why Should You Care?)

Let’s be real: backtesting is like the ultimate “what if” game for traders. What if I’d bought Apple stock in 2005? What if I’d shorted GameStop before it went viral? But here’s the kicker—what if your backtest is lying to you? Yep, that’s right.
Most backtests fail, and it’s not just because of bad data or overfitting (though those are biggies). It’s because the way you’re running your backtest might be setting you up for failure.
Enter vectorized backtesting—a method that’s faster, smarter, and way less likely to lead you astray. But how does it actually work? Let’s break it down.
The Problem with Traditional Backtesting
First, let’s talk about the old-school way of backtesting. Imagine you’re testing a trading strategy that says, “Buy when the 50-day moving average crosses above the 200-day moving average.”
In a traditional backtest, you’d simulate this trade-by-trade, day-by-day, like rewinding a movie and watching it frame by frame. Sounds tedious, right? It is. And worse, it’s slow.
Like, really slow. If you’re testing a strategy over 20 years of data, you’re looking at thousands of trades, each requiring its own calculation. By the time you’re done, you might as well have just traded in real time and hoped for the best.
But here’s the real issue: traditional backtesting doesn’t handle complexity well. What if your strategy involves multiple indicators, different timeframes, or even machine learning models?
Suddenly, you’re drowning in a sea of nested loops and spaghetti code. And let’s not even get started on the risk of overfitting—where your strategy looks amazing in the backtest but flops in real life.
Vectorized Backtesting to the Rescue
So, what’s the alternative?
Vectorized backtesting. Think of it as the difference between assembling a car piece by piece and having a factory that builds the whole thing at once. Instead of simulating each trade individually, vectorized backtesting processes all the data in one go.
It uses arrays (or vectors) to perform calculations across entire datasets simultaneously. This isn’t just faster—it’s orders of magnitude faster. And because it’s built on mathematical operations rather than loops, it’s also more accurate and less prone to errors.
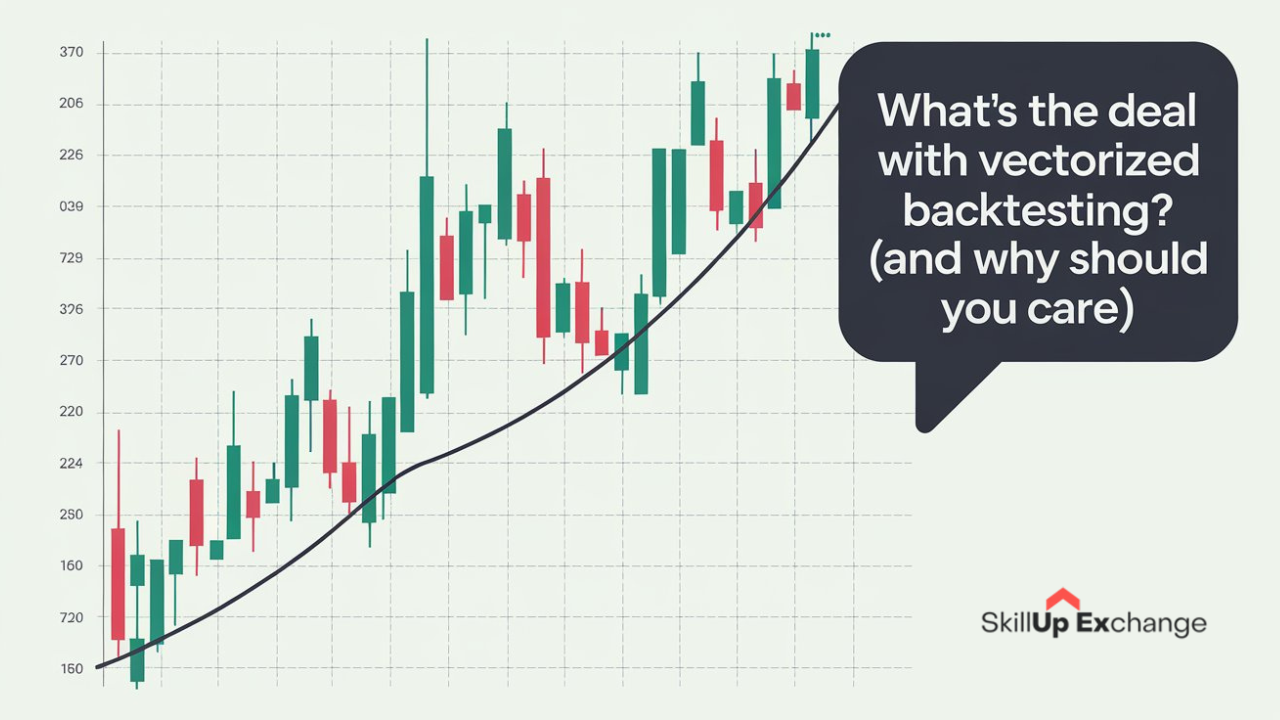
Here’s how it works in practice: Let’s say you’re testing that moving average crossover strategy again. Instead of looping through each day to check for crossovers, you’d calculate the moving averages for the entire dataset upfront. Then, you’d use vector operations to identify all the crossover points in one shot. Boom—done. No loops, no lag, no headaches.
Why Vectorized Backtesting Rocks
- Speed: If traditional backtesting is a bicycle, vectorized backtesting is a Ferrari. It can handle massive datasets and complex strategies without breaking a sweat.
- Accuracy: By avoiding loops and iterative calculations, you reduce the risk of bugs and errors creeping into your code.
- Scalability: Want to test your strategy on 50 stocks instead of one? No problem. Vectorized backtesting can handle it with ease.
- Flexibility: It plays nicely with machine learning, optimization algorithms, and other advanced techniques.
But here’s the thing: vectorized backtesting isn’t a magic bullet. It’s still possible to mess up your strategy if you’re not careful. (Remember, 90% of backtests fail for a reason.) That’s why it’s crucial to understand the nuances—like how to handle slippage, transaction costs, and survivorship bias. And if you’re serious about building robust strategies, you’ll want to dive deeper into tools like Python and libraries such as Pandas and NumPy, which are the backbone of vectorized backtesting.
A Real-World Example
Let’s say you’re testing a momentum strategy on the S&P 500. With vectorized backtesting, you’d:
- Load the historical price data into a Pandas DataFrame.
- Calculate the momentum indicator (e.g., the percentage change over the last 12 months) for all stocks at once.
- Rank the stocks based on momentum and simulate buying the top 10%.
- Repeat the process for each month in your dataset.
The result? A backtest that runs in seconds instead of hours, giving you more time to refine your strategy and less time staring at a loading bar.
The Bottom Line
Vectorized backtesting is a game-changer for traders and quants. It’s faster, more accurate, and way more scalable than traditional methods. But like any tool, it’s only as good as the person using it. If you’re not careful, you can still end up with a strategy that looks great on paper but falls apart in the real world. That’s why it’s so important to understand the pitfalls of backtesting—and how to avoid them.
Speaking of which, if you want to learn more about why 90% of backtests fail (and how GenAI can fix it), check out our blog Why 90% of Backtests Fail and How GenAI Can Fix It!. And if you’re ready to take your skills to the next level, don’t miss our course on Generative AI and Python for Algorithmic Trading and Quantitative Finance.


